Revamping a real-time, site monitoring app to boost adoption
Revamping a real-time, site monitoring app to boost adoption
Revamping a real-time, site monitoring app to boost adoption
Bringing the web-app up to modern standards much to the delight of clients and target users alike.
Bringing the web-app up to modern standards much to the delight of clients and target users alike.
Co-Creation Workshops
Co-Creation Workshops
Wireframe
Wireframe
Prototype
Prototype
UX Strategy
UX Strategy
ROLE
ROLE
Lead UX Designer
Lead UX Designer
Lead UX Designer
DOMAIN
DOMAIN
Proptech
Proptech
Proptech
TYPE
TYPE
Web App Redesign
Web App Redesign
Web App Redesign
DURATION
DURATION
1 Month
1 Month
1 Month
Nysa*, a leading proptech company in UAE, engaged us to redesign their site tagging and asset management platform
The existing web app had started to fall behind modern standards, creating friction for users who are tasked with monitoring critical operations.
Through a targeted design-sprint, we delivered a clean dashboard and a gaming HUD-inspired workspace that transformed how on-site teams managed their tasks.
The Context.
The Context.
The Context.

Fig 1: Site Inspectors (For representation purposes only)
Fig 1: Site Inspectors (For representation purposes only)
Nysa supports the management of large entities like power plants and construction sites, where manual inspection is a challenge.
The platform converts thousands of high-res images into a comprehensive digital overview, complete with inspection tools.
Safety inspection staff depend on this virtual view of the environment to quickly log issues while on their rounds.
Fig 1: Site Inspectors (For representation purposes only)
Key Challenges.
Key Challenges.
Key Challenges.
Despite it's cutting edge technology, the platform suffered from fundamental usability issues due to the design of the interface:
Despite it's cutting edge technology, the platform suffered from fundamental usability issues due to the design of the interface:
Despite it's cutting edge technology, the platform suffered from fundamental usability issues due to the design of the interface:

Critical data was out of sight, and therefore out of mind.
Critical data was out of sight, and therefore out of mind.
Critical data was out of sight, and therefore out of mind.

The viewport was heavily populated with tools and panels.
The viewport was heavily populated with tools and panels.
The viewport was heavily populated with tools and panels.

The Design Process.
The Design Process.
The Design Process.
Fig 2: Workspace Before & After (Move slider right and left)
Fig 2: Workspace Before & After (Move slider right and left)
Out of sight, Out of mind.
Out of sight, Out of mind.
Out of sight, Out of mind.
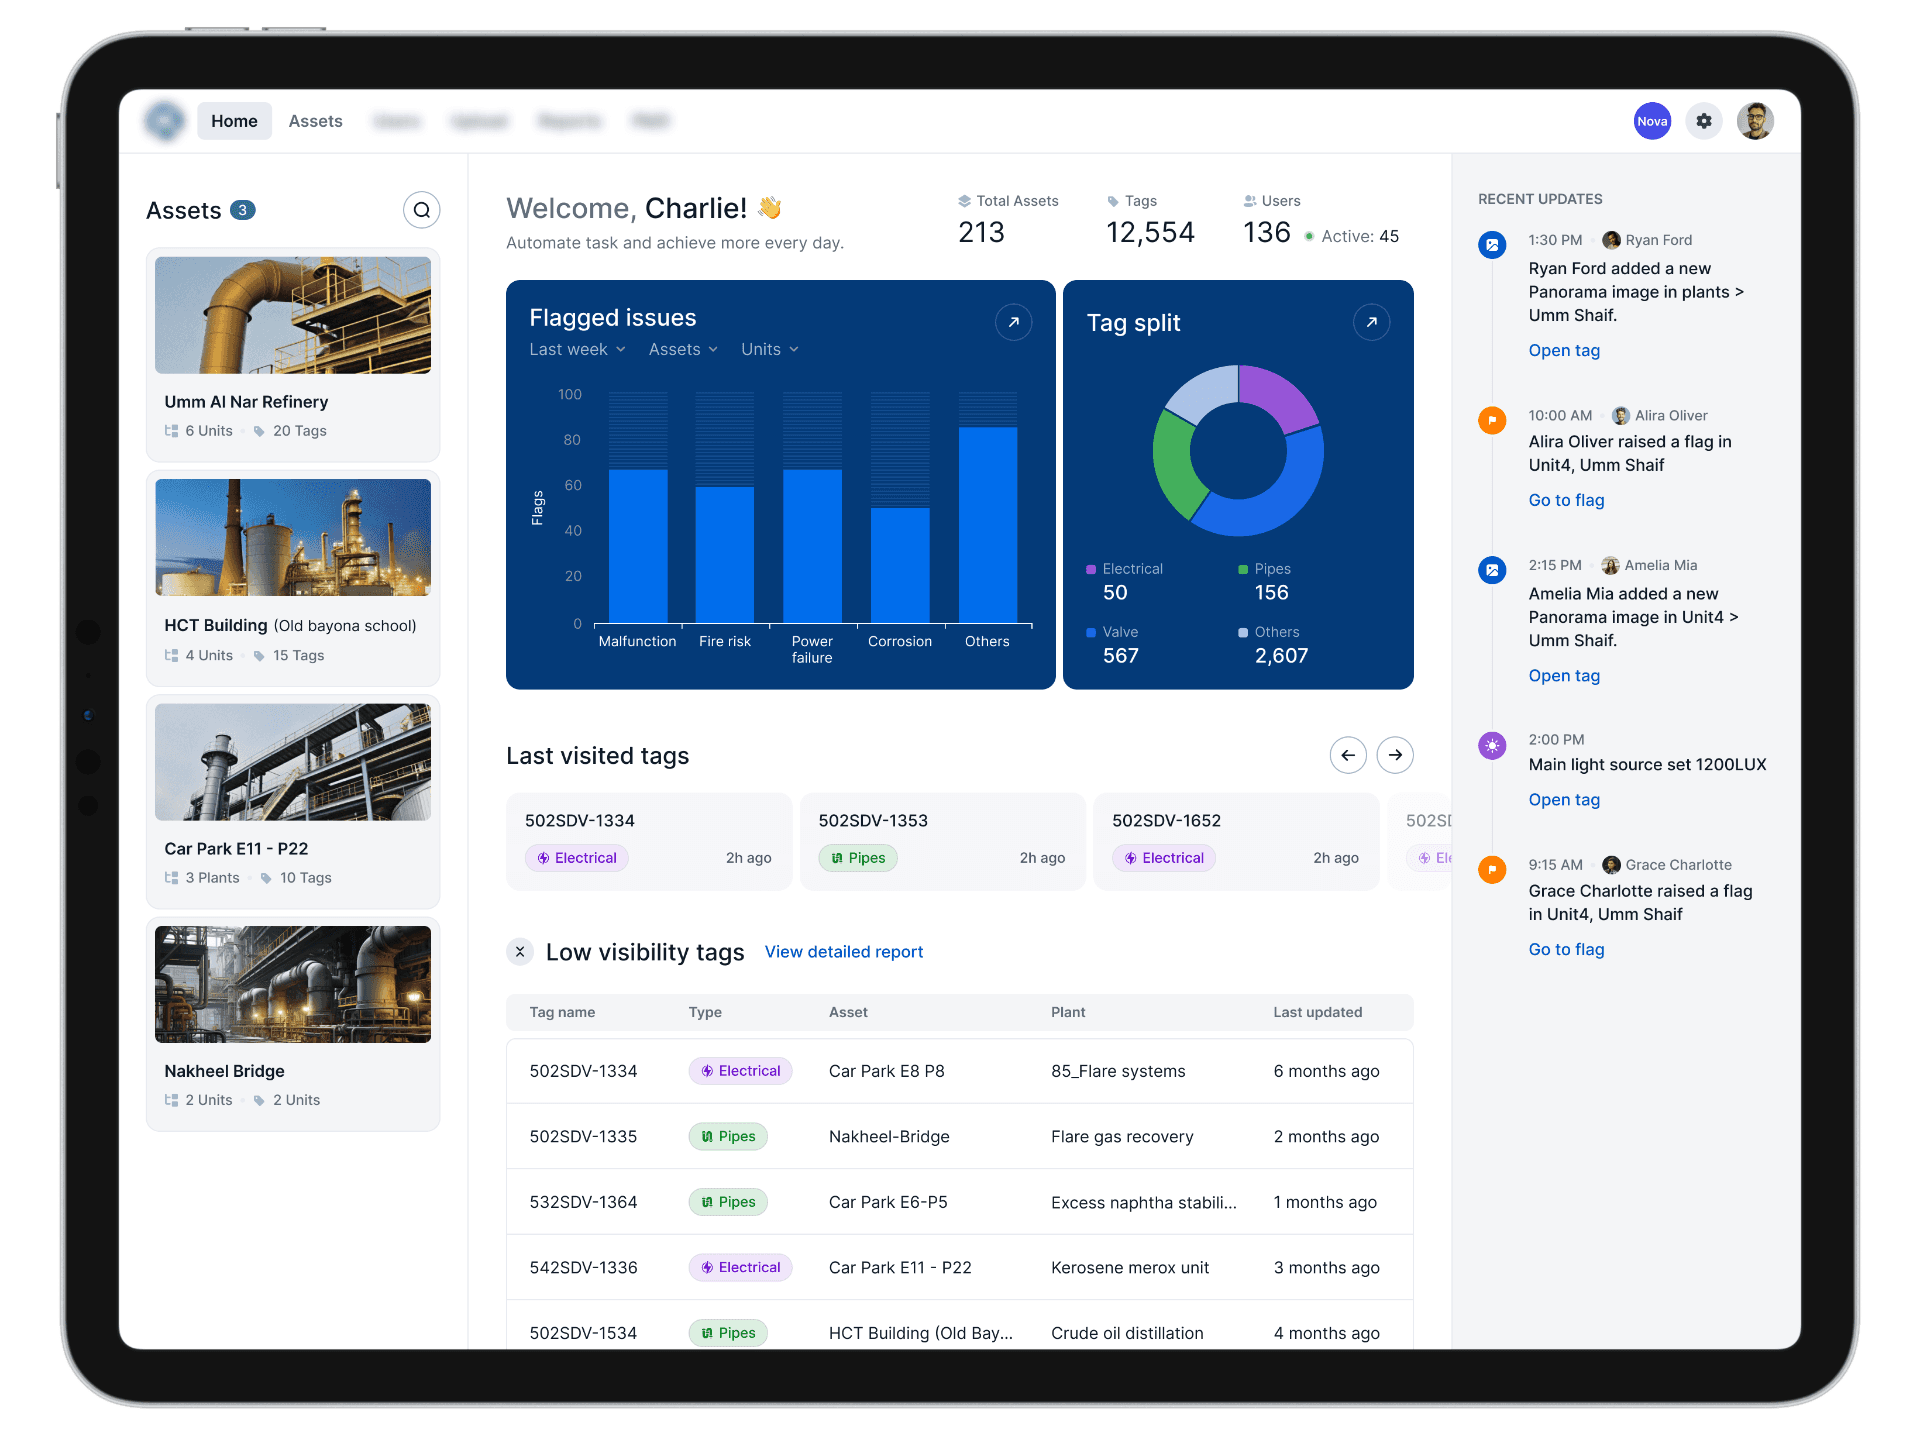
We found that the original dashboard did not surface the issues that were being logged against the system, leading to a lot of blind spots and missed alerts. For a system this critical, we needed to find a way to reorganize the data in a way that was actionable and provided a sense of urgency when needed.
To this end we did two things:
Eliminated the extra noise - the original dashboard used a lot of real estate to display metrics that were not meaningful to the user, like the total number of assets. By deprioritizing redundant signals, we managed to find room for the data that mattered more.
Creating action zones - we mapped out all the essential items for the dashboard and then divided them into three useful zones that provide related but different launchpads: access to individual projects, drill down for the analytics, and direct access to recent alerts.

Fig 3: Redesigned dashboard.
Fig 3: Redesigned dashboard.
Taking back control.
Taking back control.
Taking back control.
When it came the actual workspace where users have to log issues, we were met with a congested viewport that forced the user to go back and forth between tools.
The fix we came up with was actually inspired by Figma's workspace and Racing Game HUDs alike:
Collapsible, floating islands - By creating floating panels, we were able to maximize the viewport and kept only the relevant tools accessible. We also created a unified console, which was a masssive step up from the earlier version where every tool had it's own labelled action button (Fig 4)

Fig 4: Floating Islands
Fig 4: Floating Islands
Context-based Console - To ensure that only the relevant tools are in view, we designed a console that adapts based on the view. For eg: when switching from a photorealistic to 3D mode, advanced tools like orbit view unlock automatically (Fig 5)
Context-based Console - To ensure that only the relevant tools are in view, we designed a console that adapts based on the view. For eg: when switching from a photorealistic to 3D mode, advanced tools like orbit view unlock automatically (Fig 5)
Context-based Console - To ensure that only the relevant tools are in view, we designed a console that adapts based on the view. For eg: when switching from a photorealistic to 3D mode, advanced tools like orbit view unlock automatically (Fig 5)
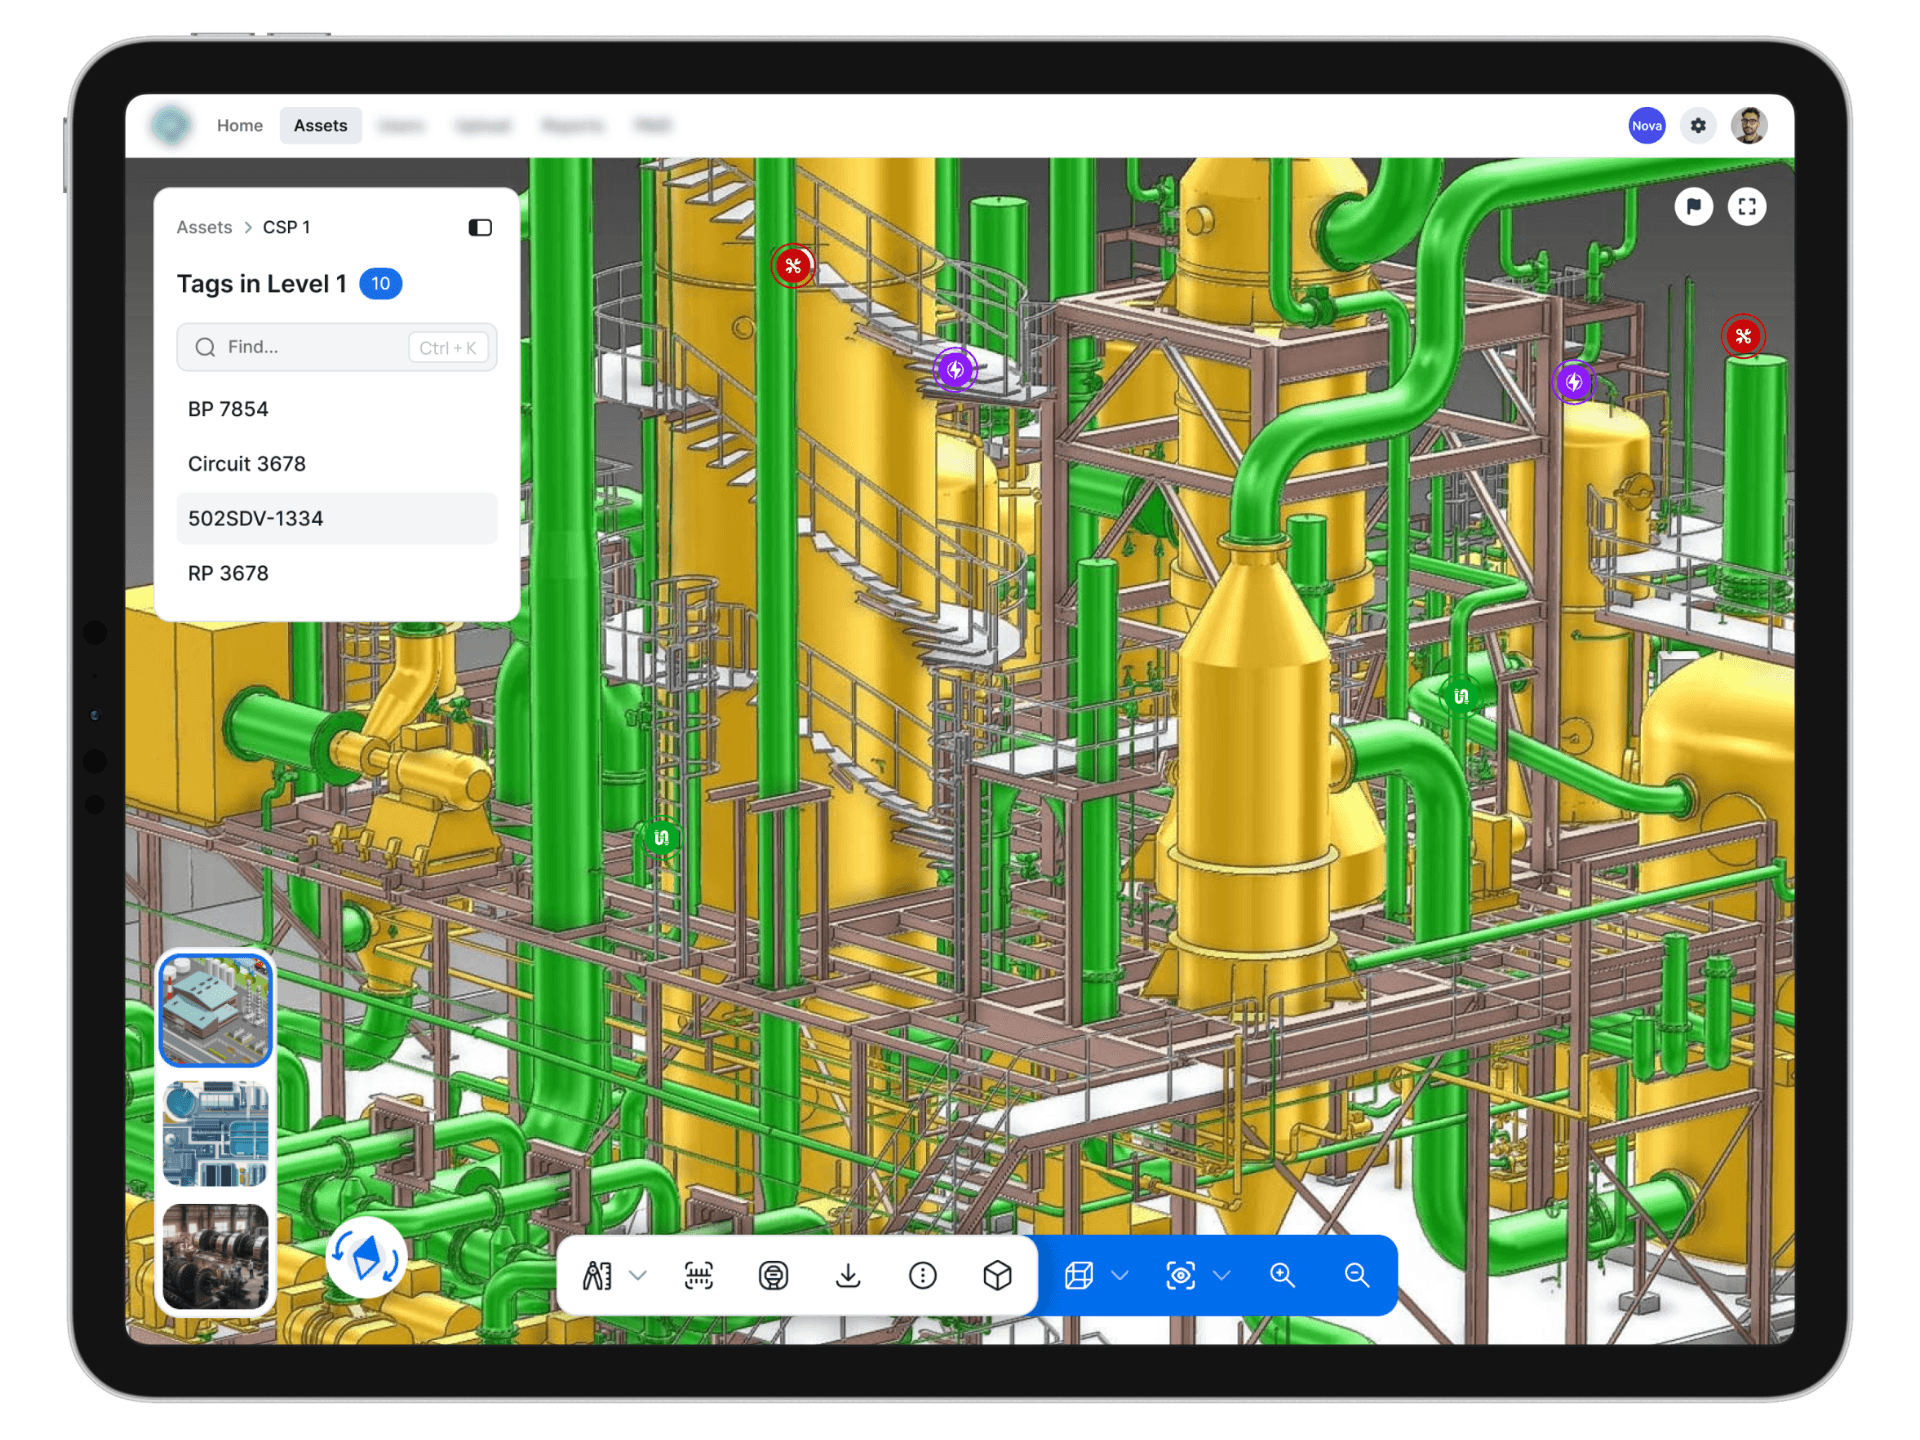
Fig 5: 3D Viewport Console
Fig 5: 3D Viewport Console
Catch me if you can
Catch me if you can
Catch me if you can
We found two glaring issues during our walkthrough, in the context of logging issues in the workspace.
One, the hotspots were based only on spatial interactions, ie. they can only be discovered through a sweep of all the hotspots in the target area. Two, all alerts were tied to individual hotspots, which limited issue reporting - after all, some problems can affect entire areas.
After multiple iterations we innovated two solutions:
Dual access - While the original hotspot logging was okay for generalized inspections, we provided a secondary way to log issues for when the user has a specific hotspot in mind - by introducing a scannable list along with a search field. (Fig 6)

Fig 6: Dual Access Hotspots
Fig 6: Dual Access Hotspots
Coordinate based flagging - We created a flagging feature that allowed logging issues against general locations, not just at pre-defined hot-spots. This simple add-on expanded the platform's effectiveness even further. (Fig 7)
Coordinate based flagging - We created a flagging feature that allowed logging issues against general locations, not just at pre-defined hot-spots. This simple add-on expanded the platform's effectiveness even further. (Fig 7)
Coordinate based flagging - We created a flagging feature that allowed logging issues against general locations, not just at pre-defined hot-spots. This simple add-on expanded the platform's effectiveness even further. (Fig 7)

Fig 7: Flagging
Fig 7: Flagging
Outcomes.
Outcomes.
Outcomes.
With this redesign, we delivered tangible improvements across various dimensions.
The number of clicks dropped significantly with the navigation becoming more intuitive and direct.
Time-on-task decreased substantially when it came to uploading images against specific hotspots.
Visual clarity improved dramatically, creating a more usable and aesthetic system.
By focusing on just a few critical flows, we achieved a widespread facelift across the platform, felt both by our clients and their existing users alike.
Key Takeaways.
Key Takeaways.
Key Takeaways.
This project gave me a new-found appreciation for the power of rapid prototyping, and the ability to fail quickly without letting my desire for perfection to get in the way of actual progress.
This project gave me a new-found appreciation for the power of rapid prototyping, and the ability to fail quickly without letting my desire for perfection to get in the way of actual progress.
This project gave me a new-found appreciation for the power of rapid prototyping, and the ability to fail quickly without letting my desire for perfection to get in the way of actual progress.
Get in touch with me for opportunities, consultations or even just a chat
Get in touch with me for opportunities, consultations or even just a chat
Get in touch with me for opportunities, consultations or even just a chat
ALL RIGHTS RESERVED. ANJANA ELANGOVAN 2025
ALL RIGHTS RESERVED. ANJANA ELANGOVAN 2025
ALL RIGHTS RESERVED. ANJANA ELANGOVAN 2025
